Use SQL Server Dynamic Management Views for identifying performance bottlenecks
Cloud is expensive! I can't stress that enough. The consumption for one of our product went from ~$600 a month to >$1000 a month over the last one year. Most of which could be attributed to scale but a lot of it is bad code too. I have been a huge fan of CodingHorror, and in turn a subscriber of his Hardware is cheap, Programmers are expensive theory. Perfectly sound advice on the desktop, sadly not for the cloud or at scale, a lesson I learnt the hard way.
One of the major costs over the past year or so for us has been SQL Azure (Yeah Azure Database or whatever MSFT decides to call it next, I am old, I am sticking to SQL Azure). The new portal does help some in identifying rogue queries. It shows
TOP 5 queries per CPU consumption (Aggregation type: sum) Last 24 hrs.
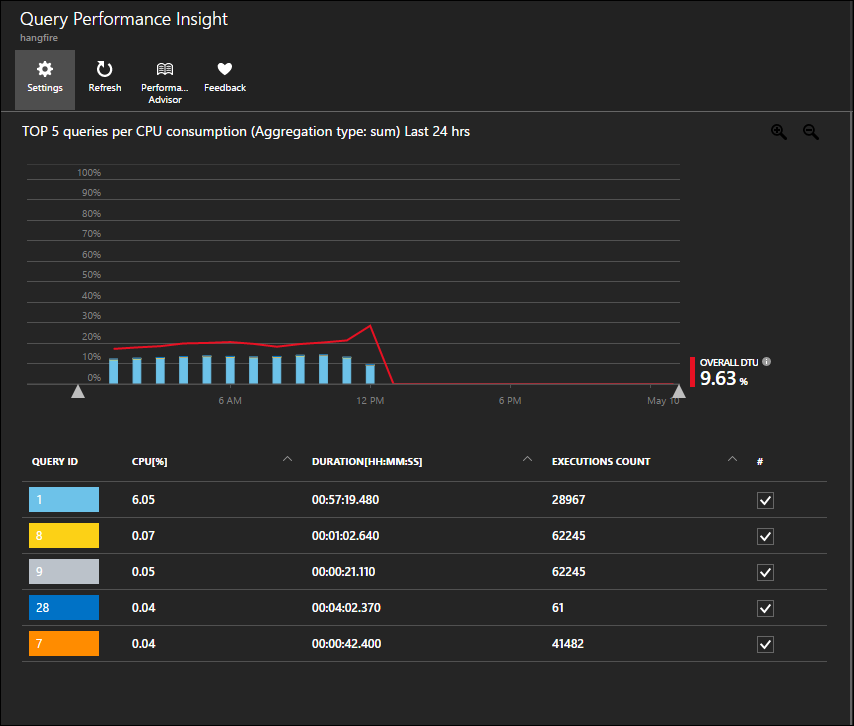
This is great, however it may not be enough for all the needs. Fret not, the stuff the chart is generated with is called Dynamic Management Views or DMV for short. These are super powerful and can reveal a lot about your database and server performance.
A little warning from Microsoft before we move ahead.
Dynamic management views and functions return internal, implementation-specific state data. Their schemas and the data they return may change in future releases of SQL Server. Therefore, dynamic management views and functions in future releases may not be compatible with the dynamic management views and functions in this release. For example, in future releases of SQL Server, Microsoft may augment the definition of any dynamic management view by adding columns to the end of the column list. We recommend against using the syntax SELECT * FROM dynamicmanagementview_name in production code because the number of columns returned might change and break your application.
With that out of the way lets dig into some queries. I've written them to include only the TOP (n), if you are reading this, I assume you are already aware and will replace the < n > with the desired number.
Run the following queries against the database you want to troubleshoot.
Queries that were executed the maximum number of times
-- Get Queries that were executed the maximum number of times
SELECT TOP (<n>)
    dmExecQueryStats.last_execution_time AS [TimeStamp],
    dmExecSQLText.TEXT AS [QueryText],
    dmExecQueryStats.execution_count AS [ExecutionCount],
    dateadd(s, convert(bigint, dmExecQueryStats.total_worker_time) / 1000, convert(time, '00:00:00')) AS [Total CPU Time Used],
    dateadd(s, convert(bigint, dmExecQueryStats.total_elapsed_time) / 1000, convert(time, '00:00:00')) AS [Total Elapsed Time]
FROM sys.dm_exec_query_stats AS dmExecQueryStats
CROSS APPLY sys.dm_exec_sql_text(dmExecQueryStats.sql_handle) AS dmExecSQLText
ORDER BY dmExecQueryStats.execution_count DESC
Queries that took maximum time to execute
-- Get Queries that took maximum time to execute
SELECT TOP (<n>)
    dmExecQueryStats.last_execution_time AS [TimeStamp],
    dmExecSQLText.TEXT AS [QueryText],
    dmExecQueryStats.execution_count AS [ExecutionCount],
    dateadd(s, convert(bigint, dmExecQueryStats.total_worker_time) / 1000, convert(time, '00:00:00')) AS [Total CPU Time Used],
    dateadd(s, convert(bigint, dmExecQueryStats.total_elapsed_time) / 1000, convert(time, '00:00:00')) AS [Total Elapsed Time]
FROM sys.dm_exec_query_stats AS dmExecQueryStats
CROSS APPLY sys.dm_exec_sql_text(dmExecQueryStats.sql_handle) AS dmExecSQLText
ORDER BY dmExecQueryStats.total_elapsed_time DESC
Queries that consumed the maximum CPU
-- Get Queries that utilized maximum CPU time
SELECT TOP (<n>)
    dmExecQueryStats.last_execution_time AS [TimeStamp],
    dmExecSQLText.TEXT AS [QueryText],
    dmExecQueryStats.execution_count AS [ExecutionCount],
    dateadd(s, convert(bigint, dmExecQueryStats.total_worker_time) / 1000, convert(time, '00:00:00')) AS [Total CPU Time Used],
    dateadd(s, convert(bigint, dmExecQueryStats.total_elapsed_time) / 1000, convert(time, '00:00:00')) AS [Total Elapsed Time]
FROM sys.dm_exec_query_stats AS dmExecQueryStats
CROSS APPLY sys.dm_exec_sql_text(dmExecQueryStats.sql_handle) AS dmExecSQLText
ORDER BY dmExecQueryStats.total_worker_time DESC
Queries executed recently
-- Get Queries executed recently
SELECT TOP (<n>)
    dmExecQueryStats.last_execution_time AS [TimeStamp],
    dmExecSQLText.TEXT AS [QueryText],
    dmExecQueryStats.execution_count AS [ExecutionCount],
    dateadd(s, convert(bigint, dmExecQueryStats.total_worker_time) / 1000, convert(time, '00:00:00')) AS [Total CPU Time Used],
    dateadd(s, convert(bigint, dmExecQueryStats.total_elapsed_time) / 1000, convert(time, '00:00:00')) AS [Total Elapsed Time]
FROM sys.dm_exec_query_stats AS dmExecQueryStats
CROSS APPLY sys.dm_exec_sql_text(dmExecQueryStats.sql_handle) AS dmExecSQLText
ORDER BY dmExecQueryStats.last_execution_time  DESC
These are the ones I used, there are far too many DMVs to cover in a blog post, however these should give a fair idea about how to use them.